Increasing trust among users by leveraging community-based data
March to May 2025
THE PRODUCT
This is a powerful map-based tool that helps our client make intelligent decisions for their cell phone coverage company.
Business decisions include:
Expanding and improving cell phone coverage
Developing new brick and mortar stores
Competitor acquisition
THE PROBLEM
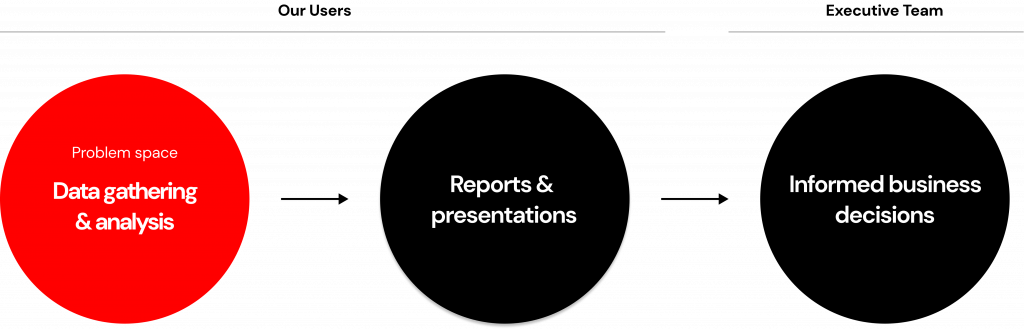
Research showed users struggled to find reliable data for their final deliverables, reports and presentations for the executive team, eroding trust.
The lack of data validity in the platform reduced user trust and increased errors in user reports/presentations, which had negative downstream effects.
SOLUTION PREVIEW
Our solution addressed users' lack of trust in the data and reduced repetitive tasks by centralizing the most common data.
Here is a preview of the solutions before jumping into the process.
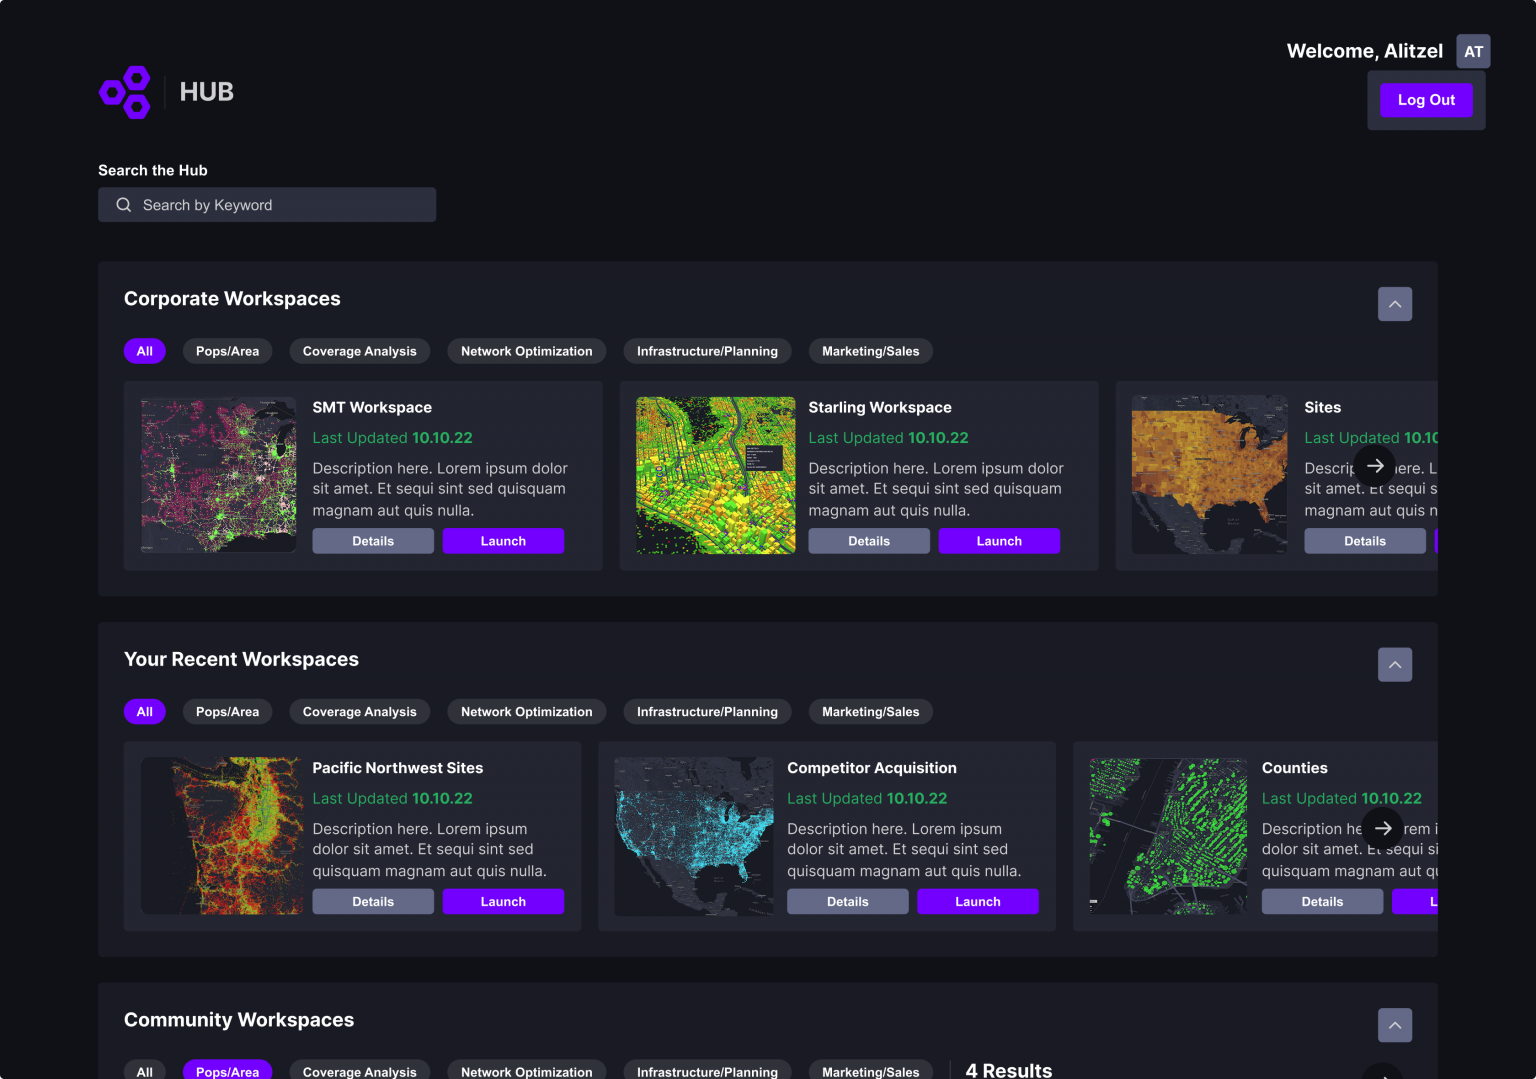
The new Hub experience allowed users to quickly find validated data, increasing trust.
OUR TEAM
Our small consulting team's task was to improve the usability of the platform and increase user adoption.
To do this, my co-designer and I interviewed a handful of users and reported back to the rest of the team: 3 developers and the Product Manager.
USER GROUP
Our users are unique. They’re engineers who use maps to identify areas to improve cell phone coverage.
The engineers’ main goal is to create reports or presentations for the executive team by using data to analyze specific geographic areas.
RESEARCH
But in order to increase trust, we set out to understand: how were they using the platform? We talked to a handful of users to find out.
Constraints
Our client granted us limited access to users and back end data, based on their priorities
We worked within a limited design system
Branding and content has been sanitized for confidentiality
Goal
Our goal was to understand whether the platform served more of a sandbox for power users and more of a browsing tool for non-experts.
Raw Interview Notes
TWO RESEARCH INSIGHTS TO DRIVE DESIGN
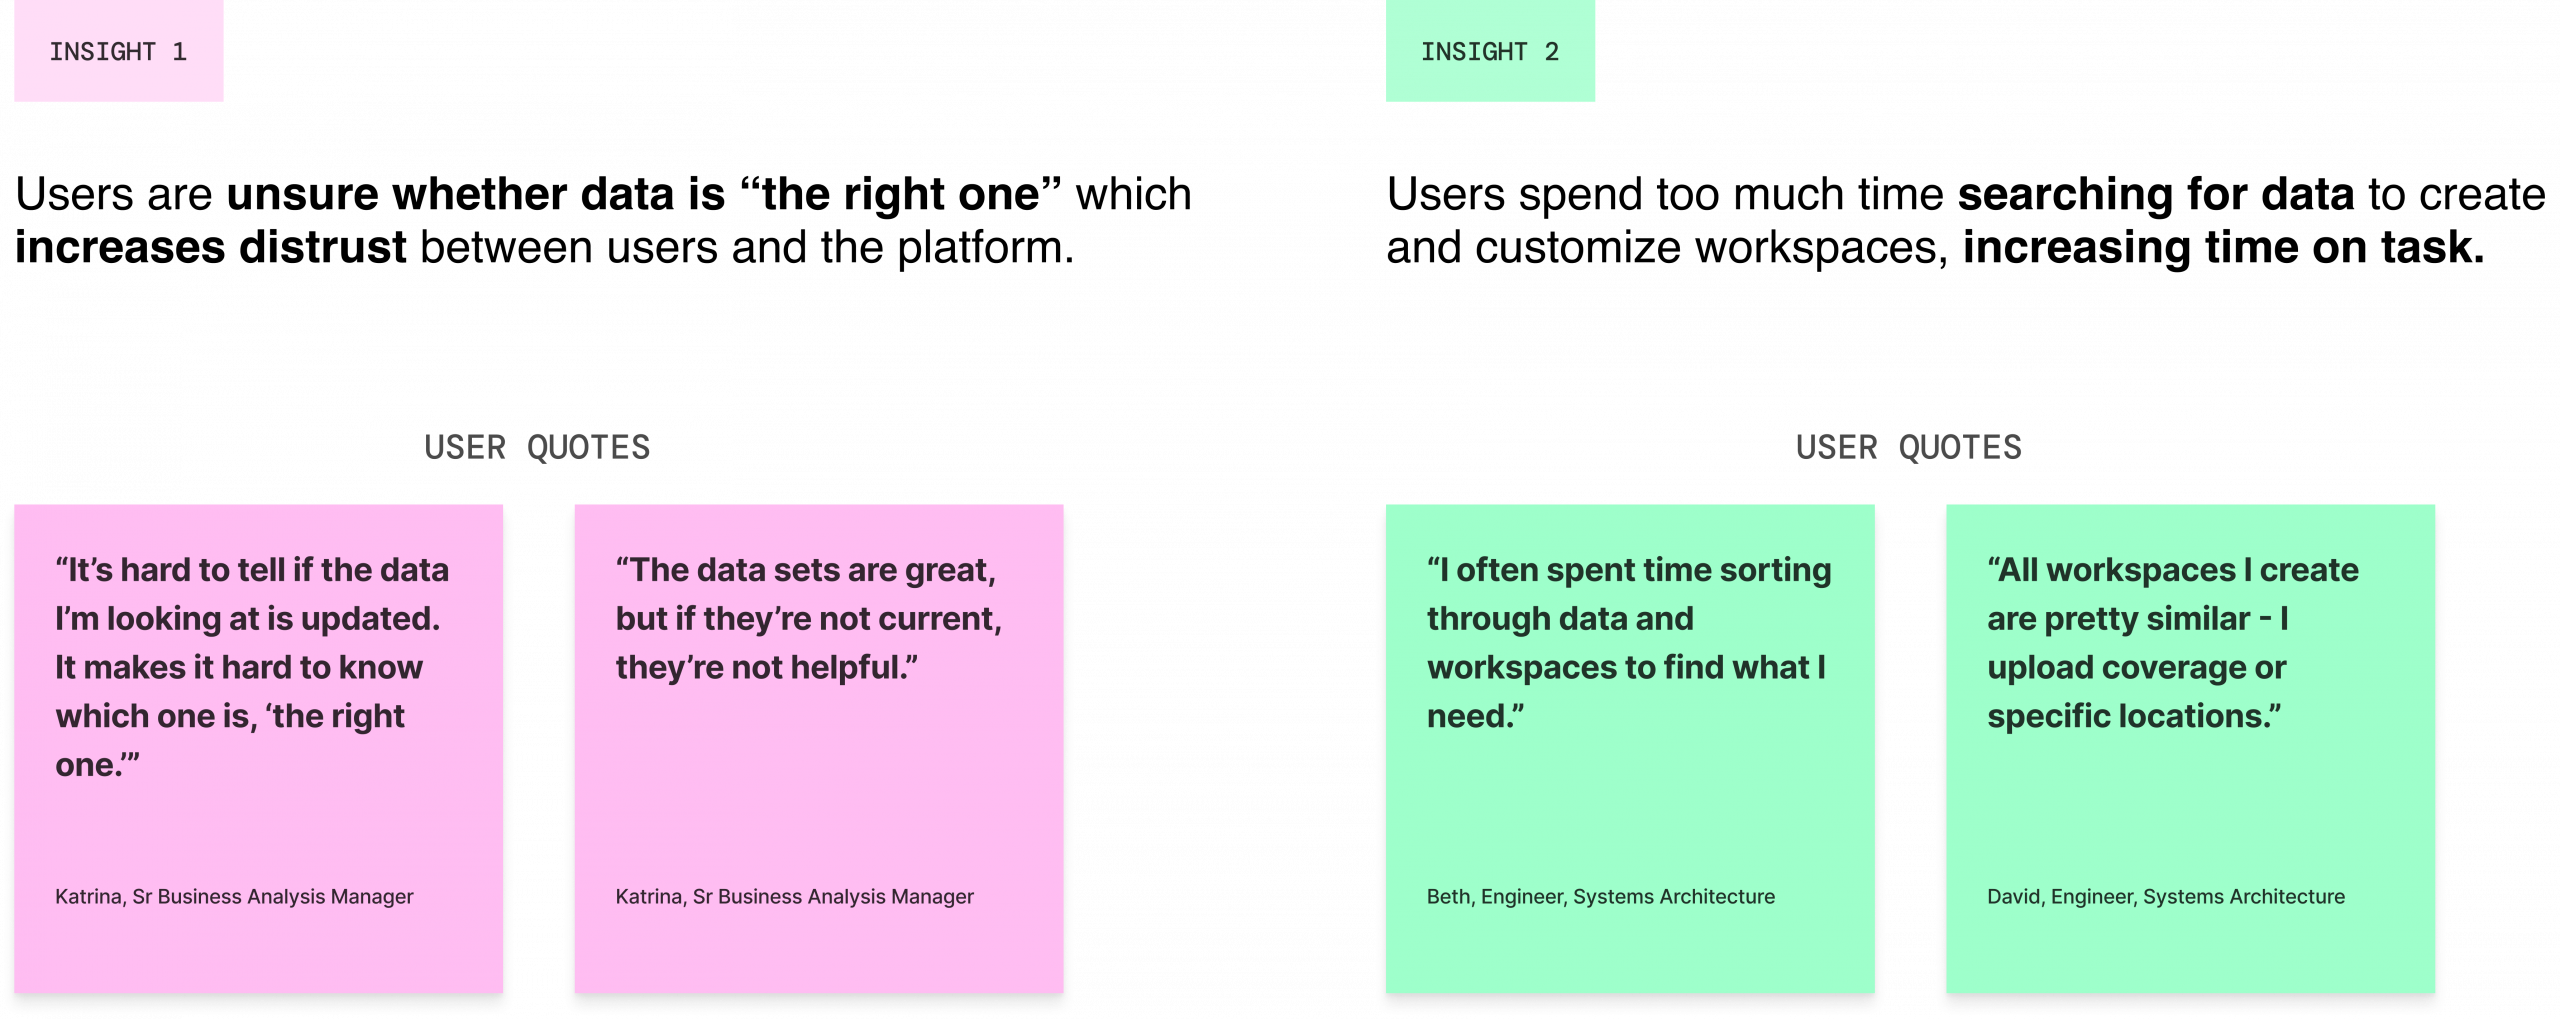
The research yielded two main insights, which guided the design process.
Users are unsure whether data is “the right one” which causes distrust between users and the platform.
Users reported they were often unsure of how updated a data set was or if it contained the data they needed to see, which was crucial for their reports. They became uncertain about whether data sets were the “right ones,” which created distrust in the work their work in the platform.
To address this issue, we thought: how might we create more trust between users and the data? Ultimately, to increase the accuracy of the users' work and increase platform usage.
Priority criteria was based on implementation effort and user impact.
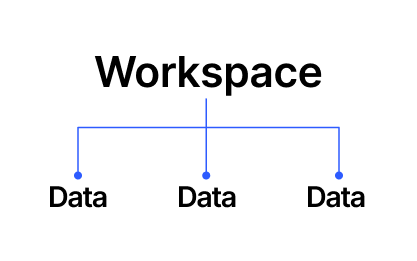
Thanks to user suggestions, we explored the idea of a "Hub," which organized data into canned workspaces.
In order to increase trust and accuracy, the new Hub would include:
Latest data sets
Basic data details
Approved data by leadership
USER SUGGESTIONS
The canned workspaces would be created by team leads and data owners, to ensure data was accurate and updated.
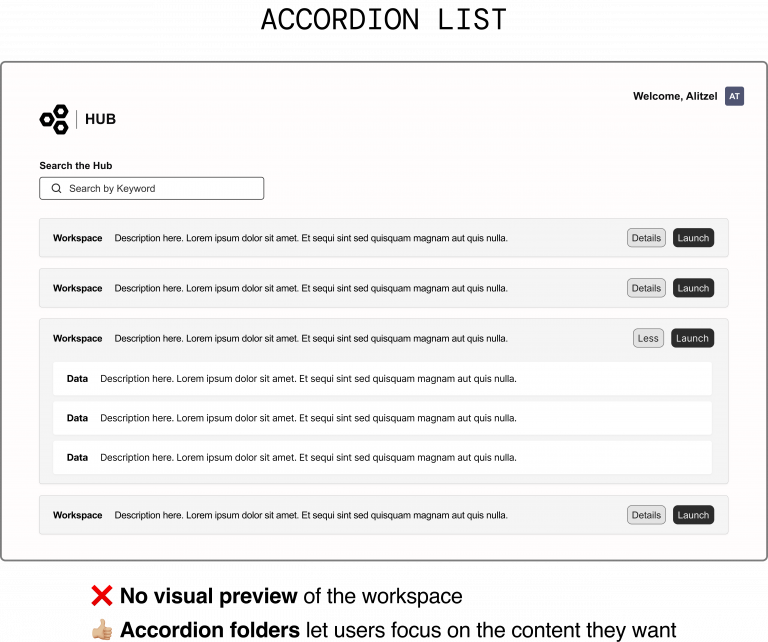
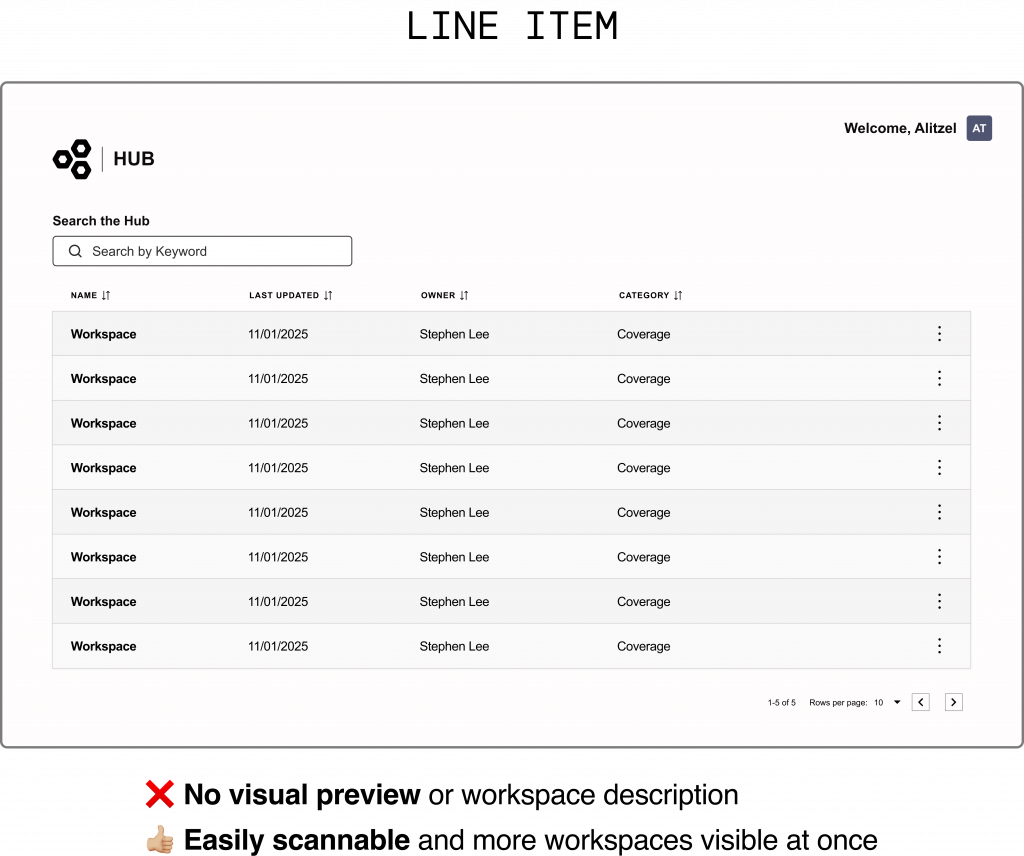
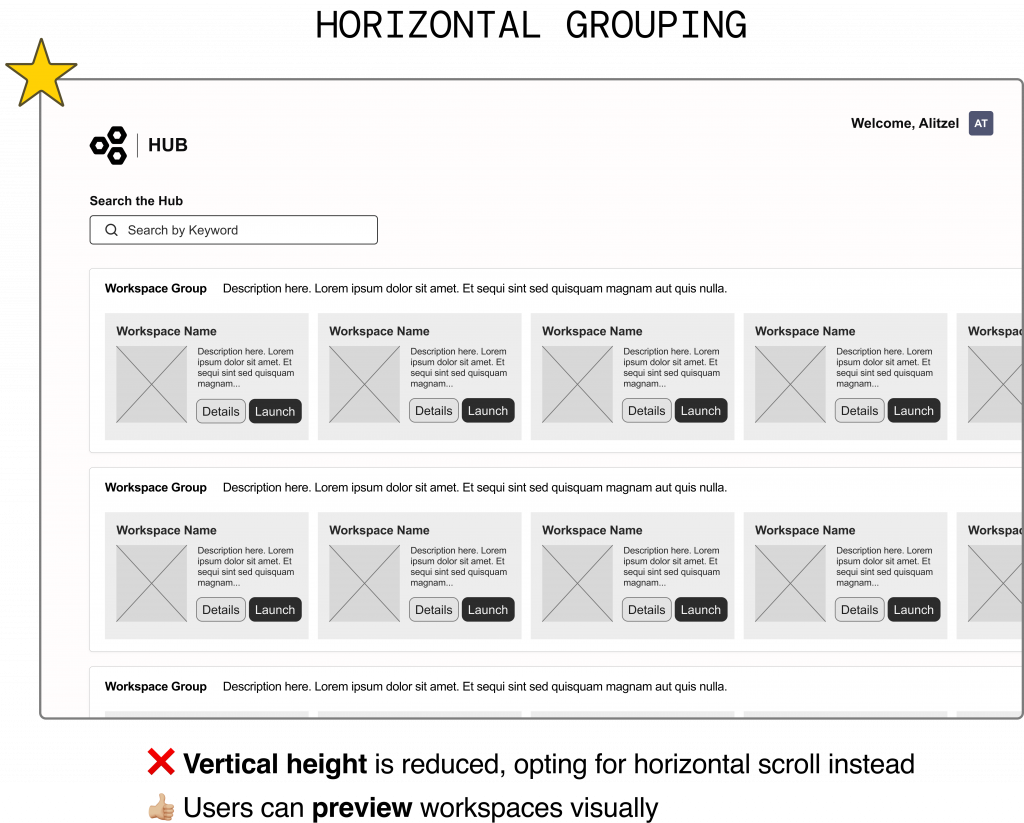
After exploring UI options, we landed on a horizontal grouping experience for its visual and written previews and scannable groups.
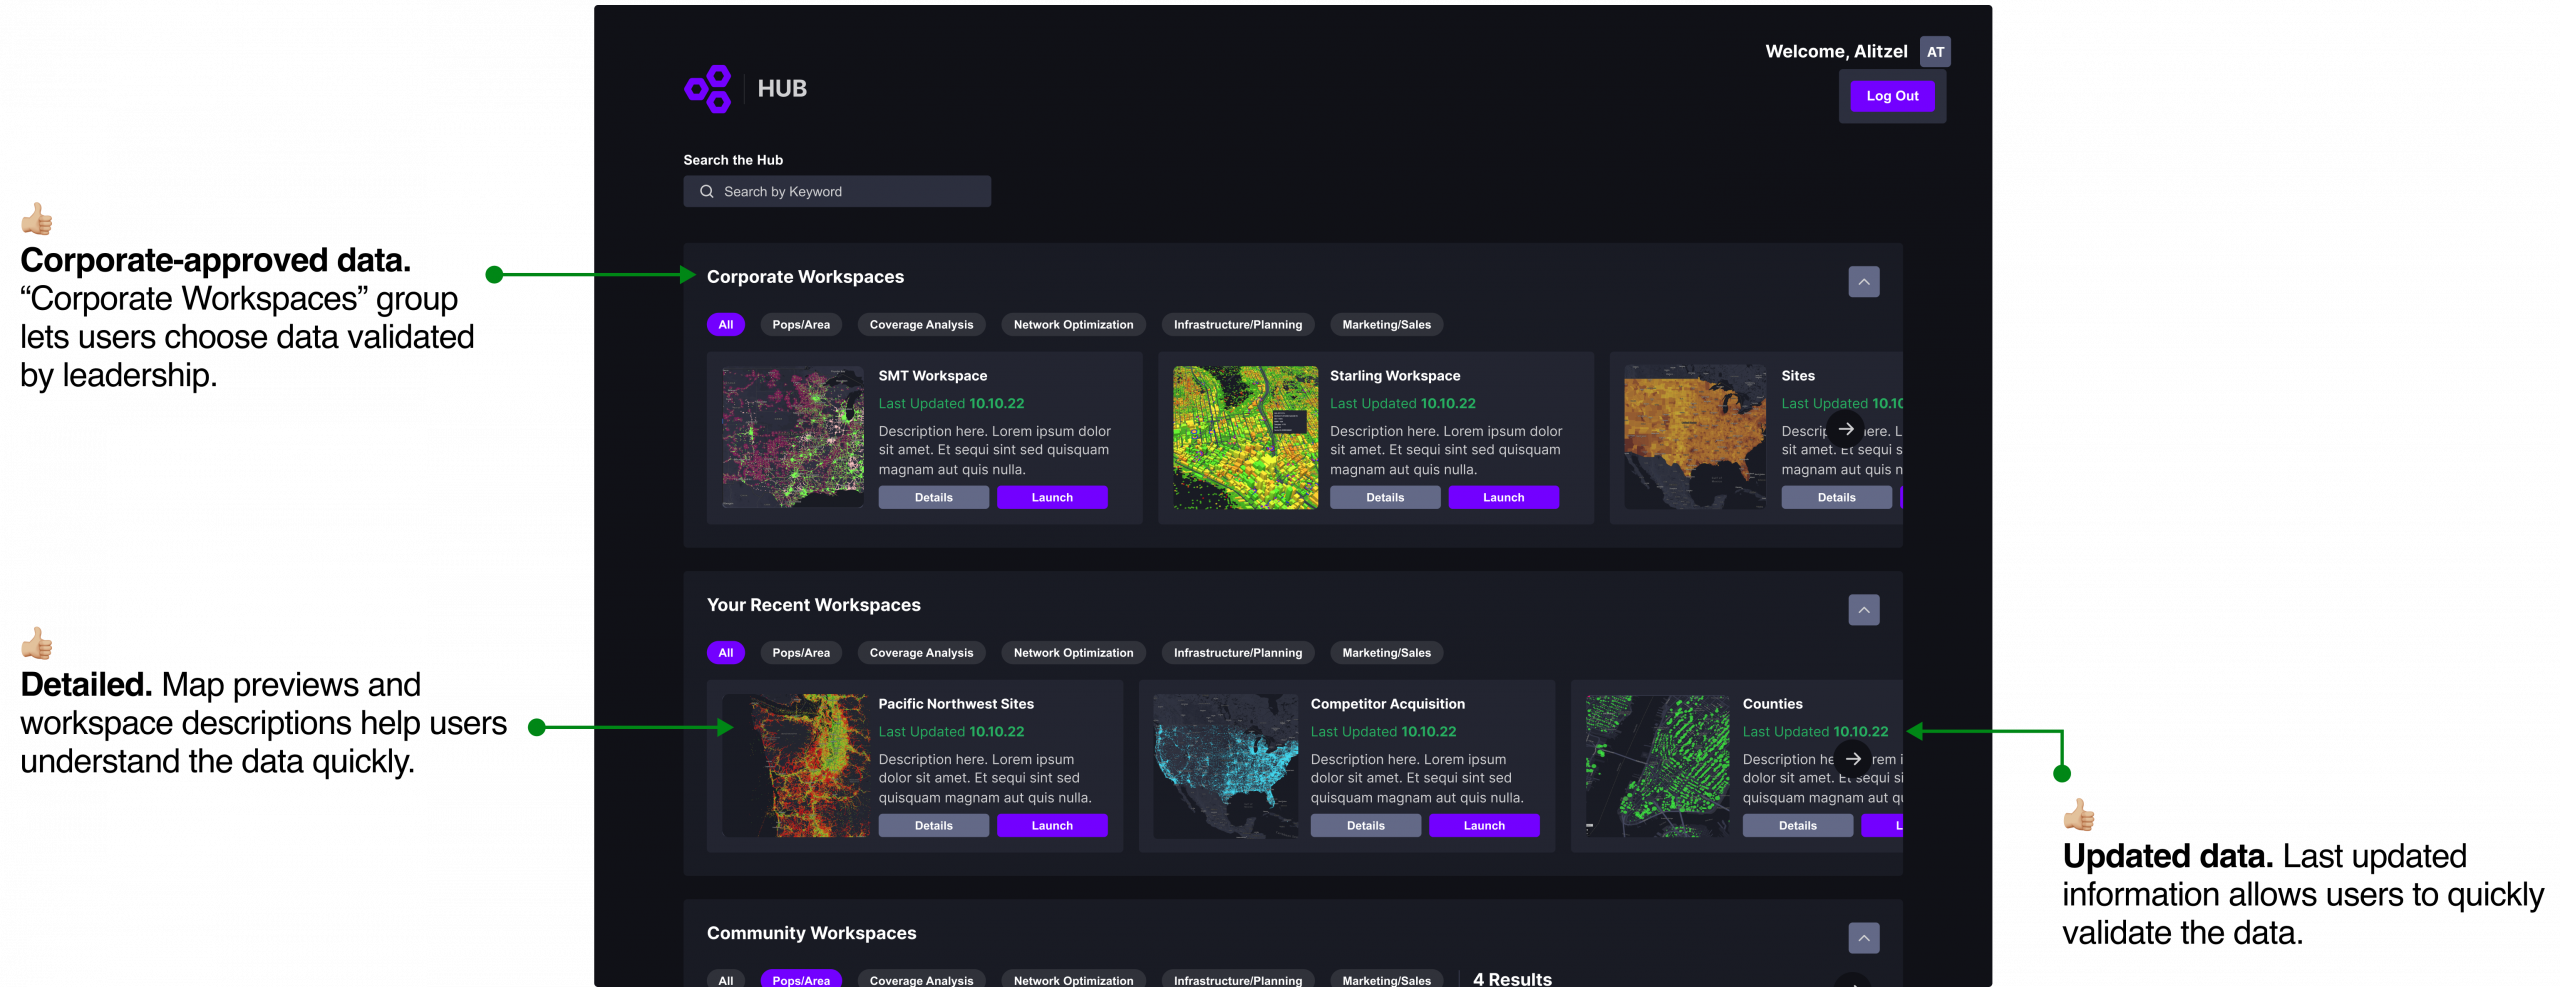
The canned workspaces and map previews in the Hub centralized validated data to address users' distrust in the data.
Insight 1 Hub Solution
In addition to addressing user trust issues, we sought to address the second research insight: workflow inefficiency.
Users spend too much time repeating actions to create and customize workspaces, increasing time on task.
Users typically create workspaces with similar data for different requests. Looking for the right data or workspace each time is redundant and time-consuming.
This led us to think: how might we streamline the process of creating/editing a workspace to reduce time on task and repetitive actions?
Priority criteria was based on implementation effort and user impact.
OUR FOCUS
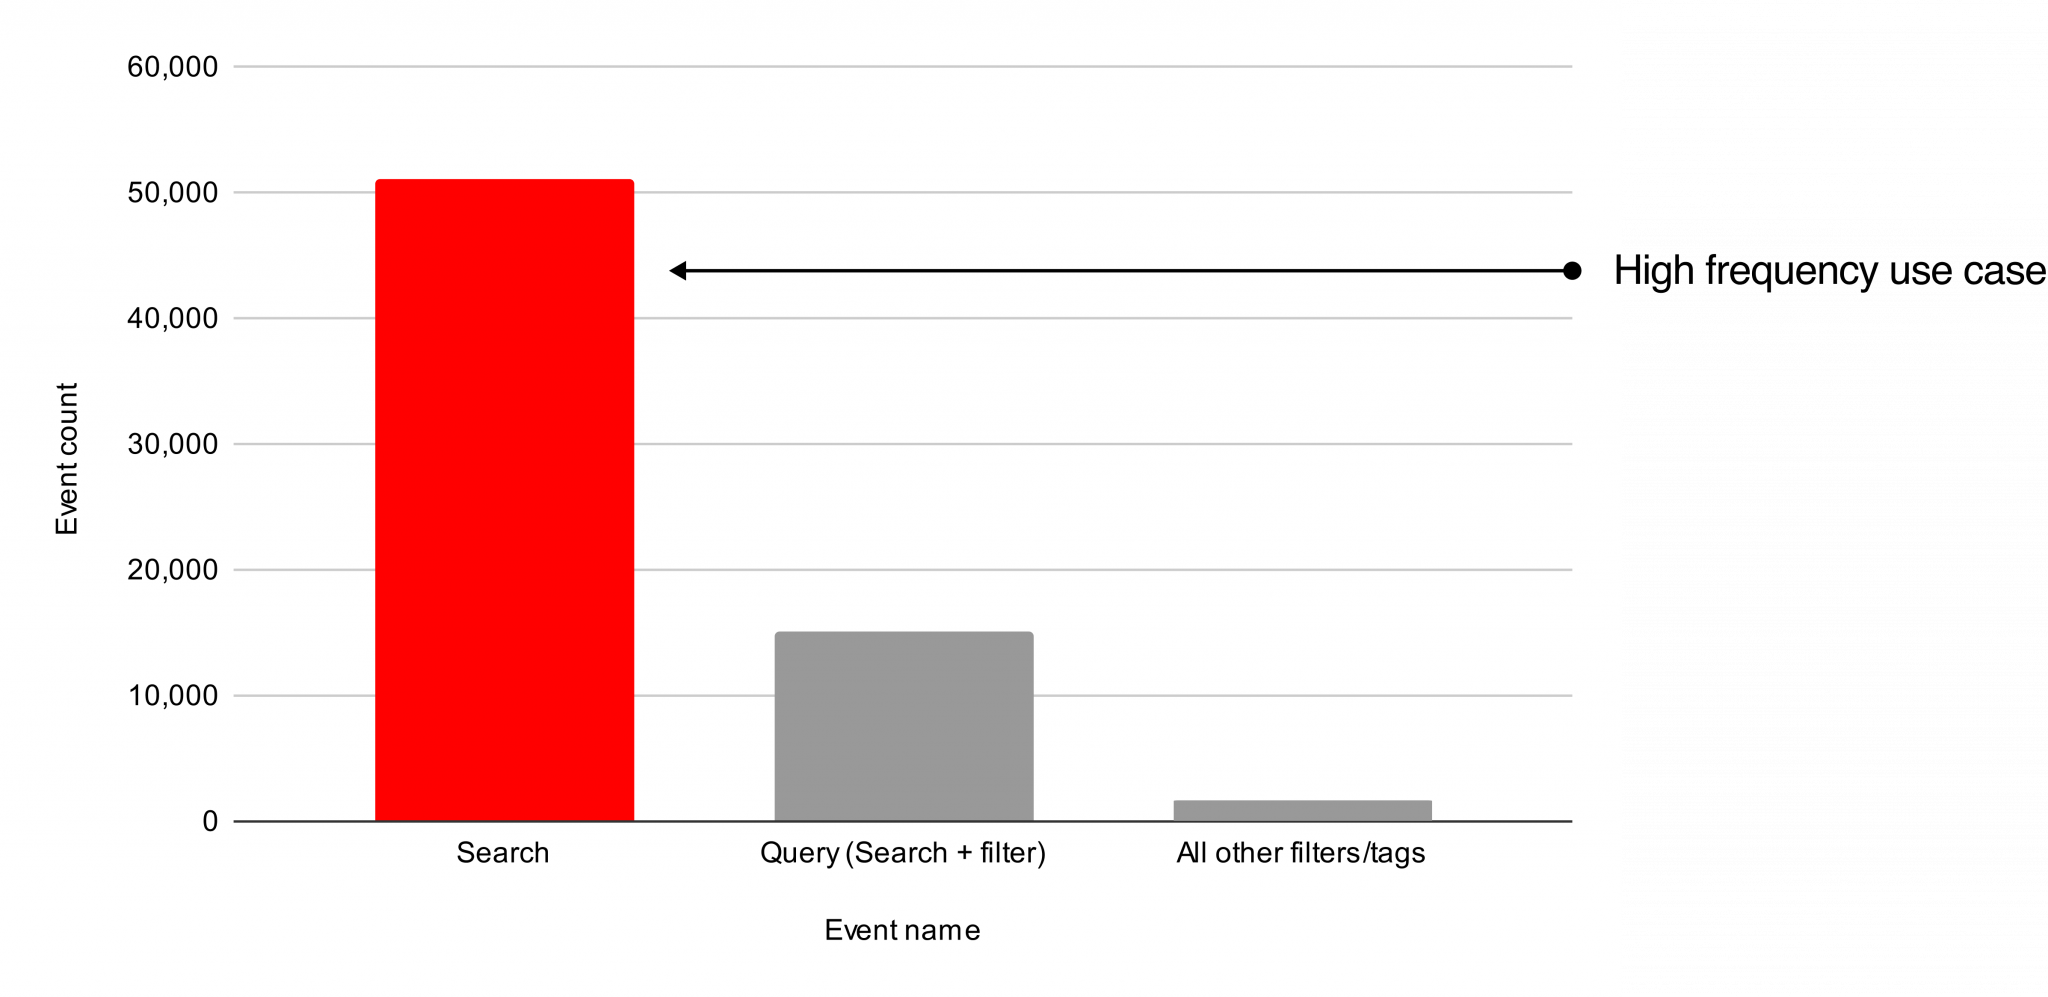
Users rely heavily on the search and query functions to quickly find the right data.
Since users search for similar data sets often, we focused on how we could improve the search experience.
Back-end data provided by engineering team
current search experience
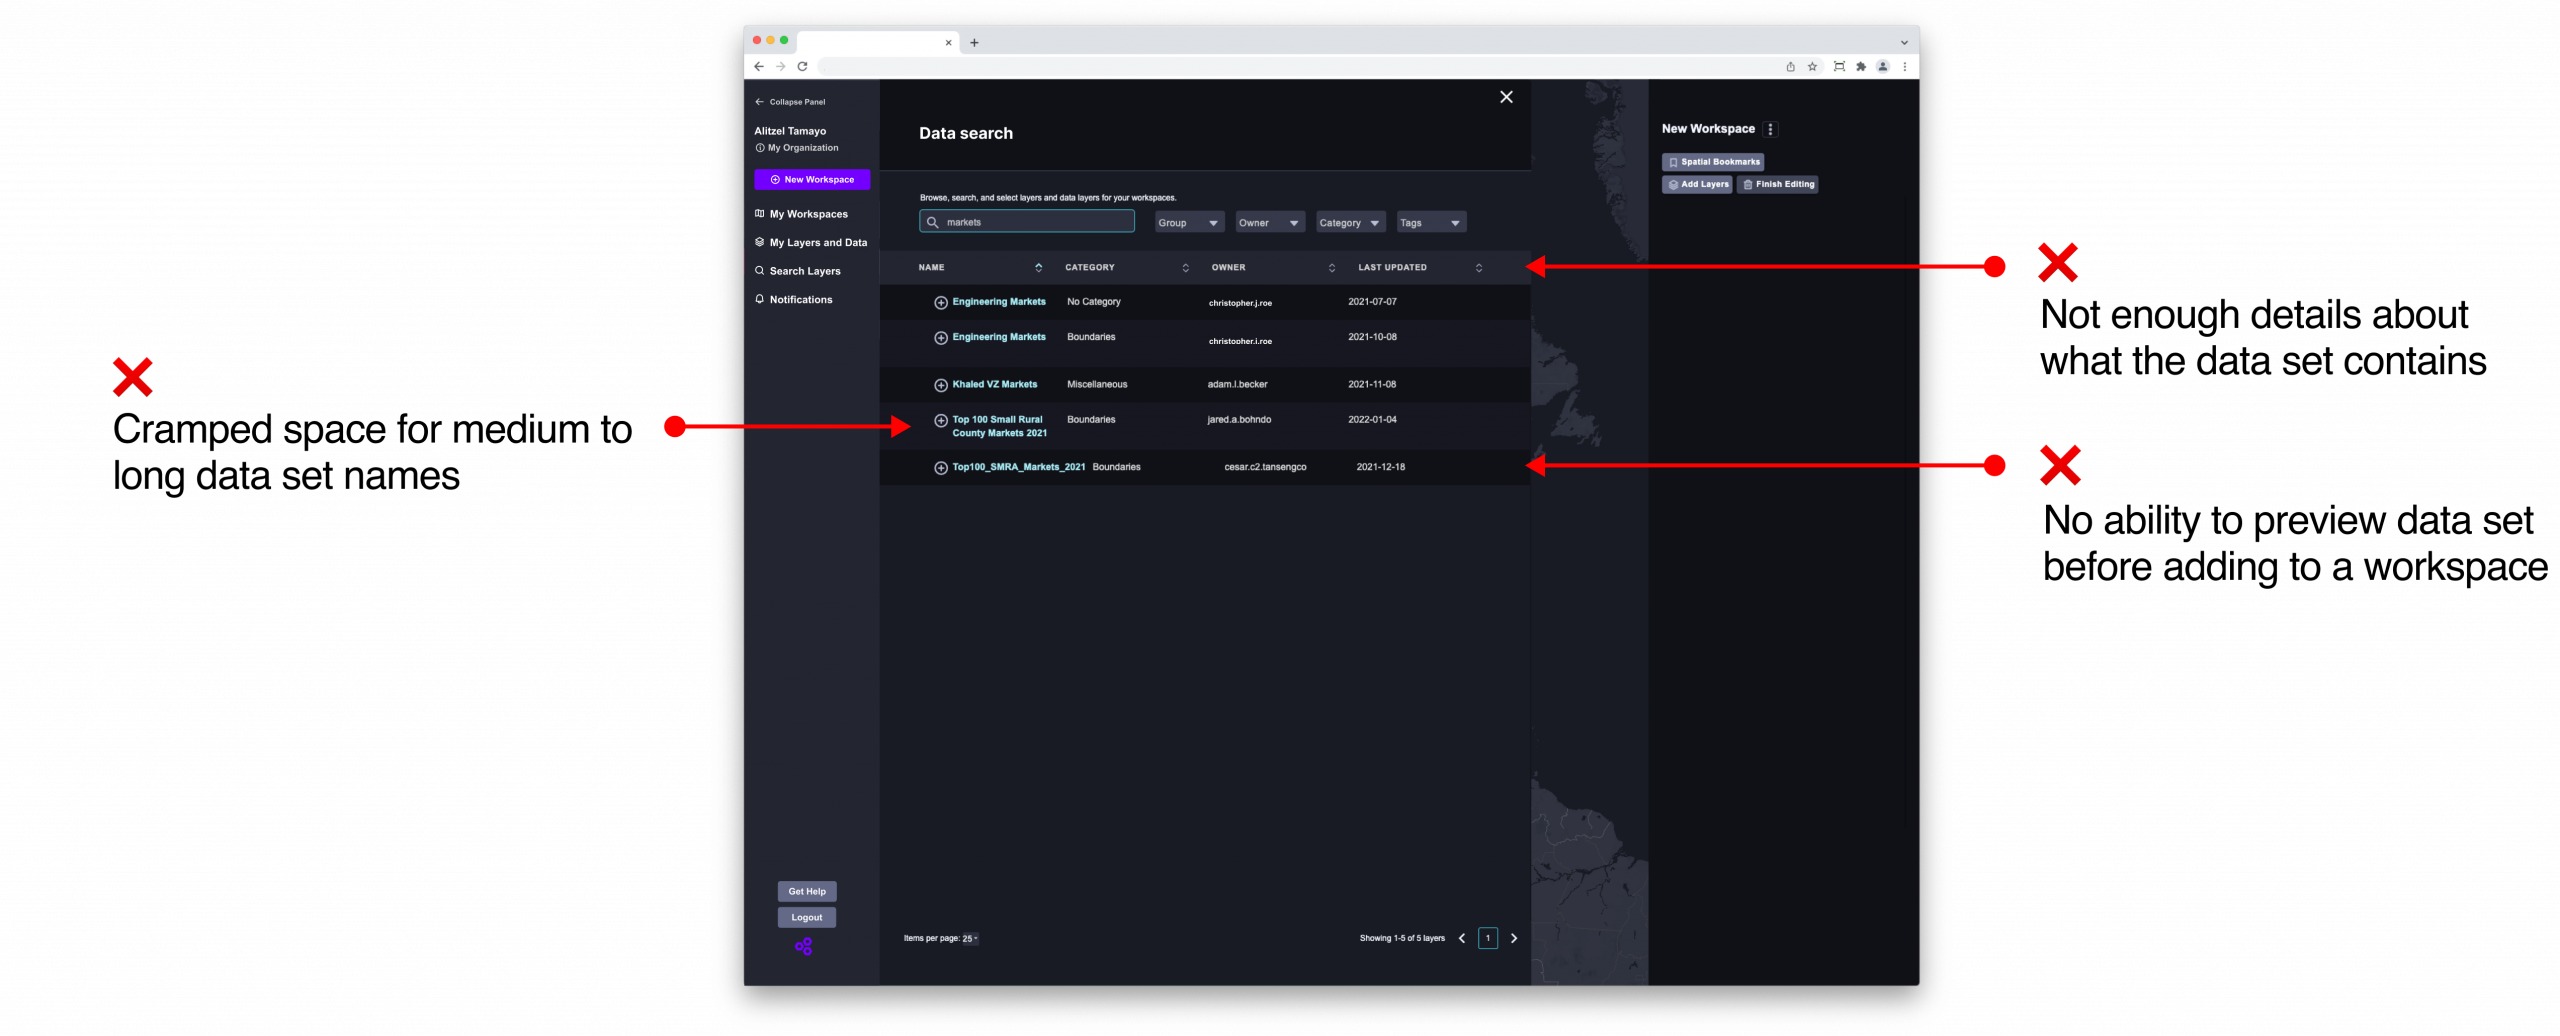
The current search experience lacked the information and previews for users to quickly find what they need.
Original Search UI
SOLUTION
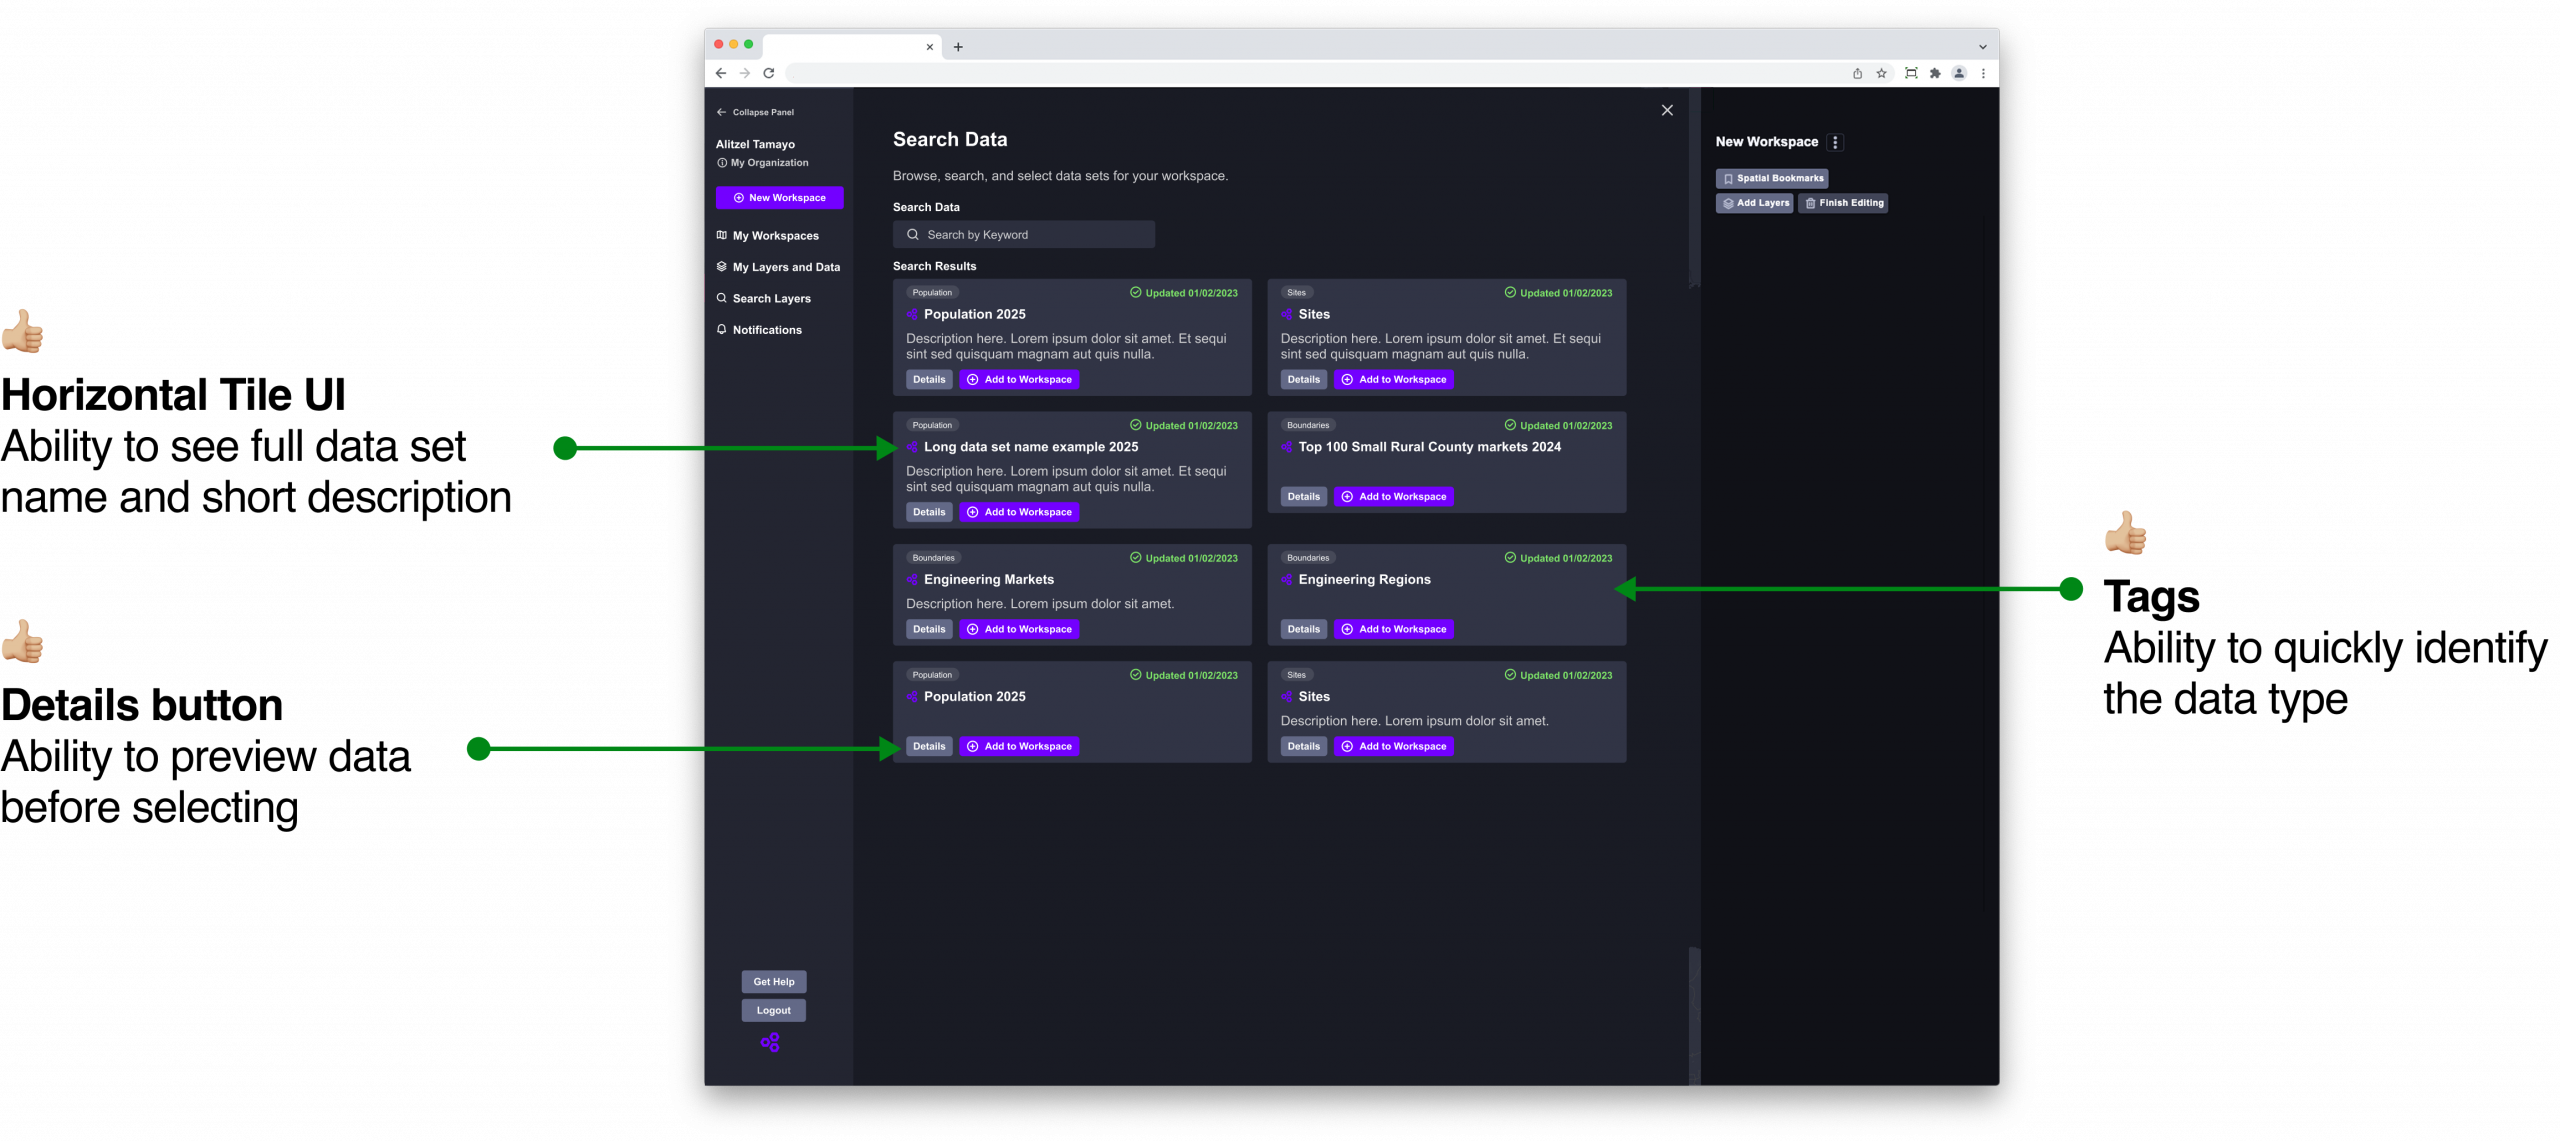
We updated the data search experience to include a description, the ability to preview, and tags to improve filtering.
Updated Search UI
Search Results Modal
SOLUTION CONT.
<span data-metadata=""><span data-buffer="">We didn’t just update the search experience; we curated a section of the hub to highlight frequently used data so that users can quickly pull them for their own reports.
User Quote
Community Workspaces
A UNIFIED SOLUTION
<span data-metadata=""><span data-buffer="">Our final solution included a new Hub for workspaces and a re-designed Search experience for datasets.
User Pain Point
Our Solution
<span data-metadata=""><span data-buffer="">The new Hub gives users a centralized place to find corporate-approved and community workspaces.
<span data-metadata=""><span data-buffer="">The updated search experience grants users more detail about the data sets they’re looking for to improve efficiency and speed.
<span data-metadata=""><span data-buffer="">We created new design artifacts and outlined the specs for our development team to ensure the designs were scalable and replicable.
<span data-metadata=""><span data-buffer="">Based on conversations with users in the exploration phase, we are confident that the changes we made improved users’ experience with the platform.
Because of client priorities, our team was not able to measure the impact of the design changes made. If I had access to client data, I would measure the impact of the following with my product manager.
Customer satisfaction survey
Taking a baseline pulse before and after launching the changes would allow us to measure the impact of our designs. The feedback collected could directly inform iterations of the design.
Rate of export
An increase in rate of export could point to the level of trust users have in the platform. If users trust the platform, they may increase the level of export of their data sets.
Rate of data set upload
A decrease in rate of data set uploads would point to users feeling confident enough in the data already in the platform. Of course, even up-to-date data today would need to be replaced eventually, so we don’t expect data set uploads to end altogether.